MTF cycles is better than ever before
- Time based confirmation to fine tune trade entry
- Automatic cycles detection
- Multi timeframe analysis and presentation
- Cycle based price forcast
- Extendable & customizable on your request
1 licence = 1 MT4 account, one time fee, updates free
sent via email within 24 hours

MTF cycles opinion. Lorem ipsum dolor sit amet, consectetur adipiscing elit.
What is MTF cycles indicator?
What is MTF cycles indicator?
Cycles are something we are studying and using at TradingArsenal for some years already. It was not the Holy Grail by itself, but enough of magic within, so we continued our research. Cycles help to fine tune the entry, act as additional time based confirmation, they work nicely in conjunction with the geometric and harmonic patterns (market fractals).
The issue is that, at the same time several cycles are acting and we need to select the right ones, actually even including the SUM OF right ones.
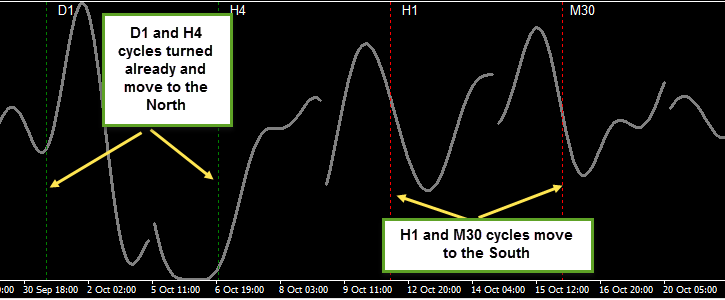
Therefore, we look for places where at least 2 dominant cycles are at their bottoms or tops. Often the turn of the cycle from one timeframe (e.g.: M15) confluences with the turn on another timeframe (e.g.: H4). It's not mandatory to be the exact same moment in time, but helps. It's the same as when two geometric patterns from two different timeframes meet in the same place. This is the high probability and best Reward:Risk trading.
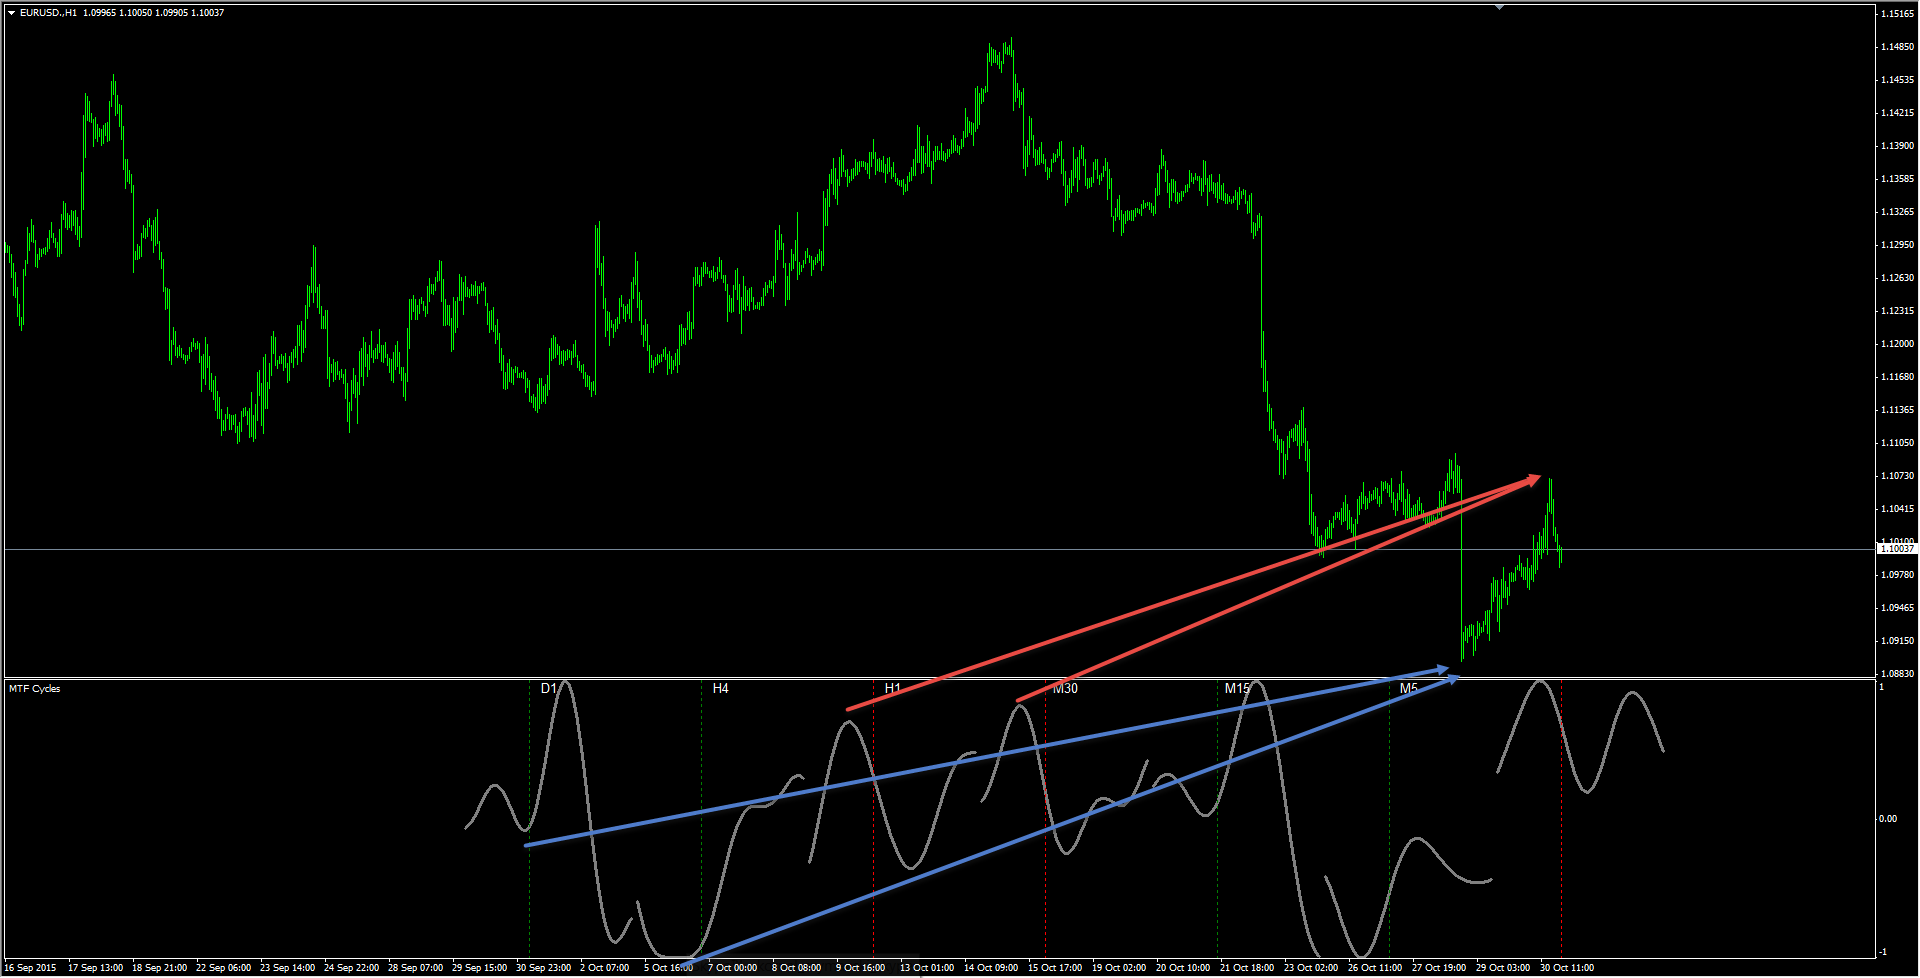
Few years ago we created this cycle indicator. It looks for cycles on a given timeframe and calculates the mathematical sum of them. Then we extended the idea to apply the same algorithm on multiple timeframes and present the result from all MT4 timeframes on 1 page. This is how this indicator was created (around 4-5 years ago) and this is how it looks and works today.
Dotted vertical lines (green, red, white) show the current moment of time. Green colour indicates that according to the cycle price should continue to move up north. Red - that price should move south. Line turns white when cycle turns, price passes thru extreems (bottom or top). Gray line before the vertical line represents the price history (price move that already happened), and gray line after the vertical line is the forecast.
Frequently Asked Questions
-
How do I change my password?
Lorem ipsum dolor sit amet, consectetur adipisicing elit. Quae quidem blanditiis delectus corporis, possimus officia sint sequi ex tenetur id impedit est pariatur iure animi non a ratione reiciendis nihil sed consequatur atque repellendus fugit perspiciatis rerum et. Dolorum consequuntur fugit deleniti, soluta fuga nobis. Ducimus blanditiis velit sit iste delectus obcaecati debitis omnis, assumenda accusamus cumque perferendis eos aut quidem! Aut, totam rerum, cupiditate quae aperiam voluptas rem inventore quas, ex maxime culpa nam soluta labore at amet nihil laborum? Explicabo numquam, sit fugit, voluptatem autem atque quis quam voluptate fugiat earum rem hic, reprehenderit quaerat tempore at. Aperiam.
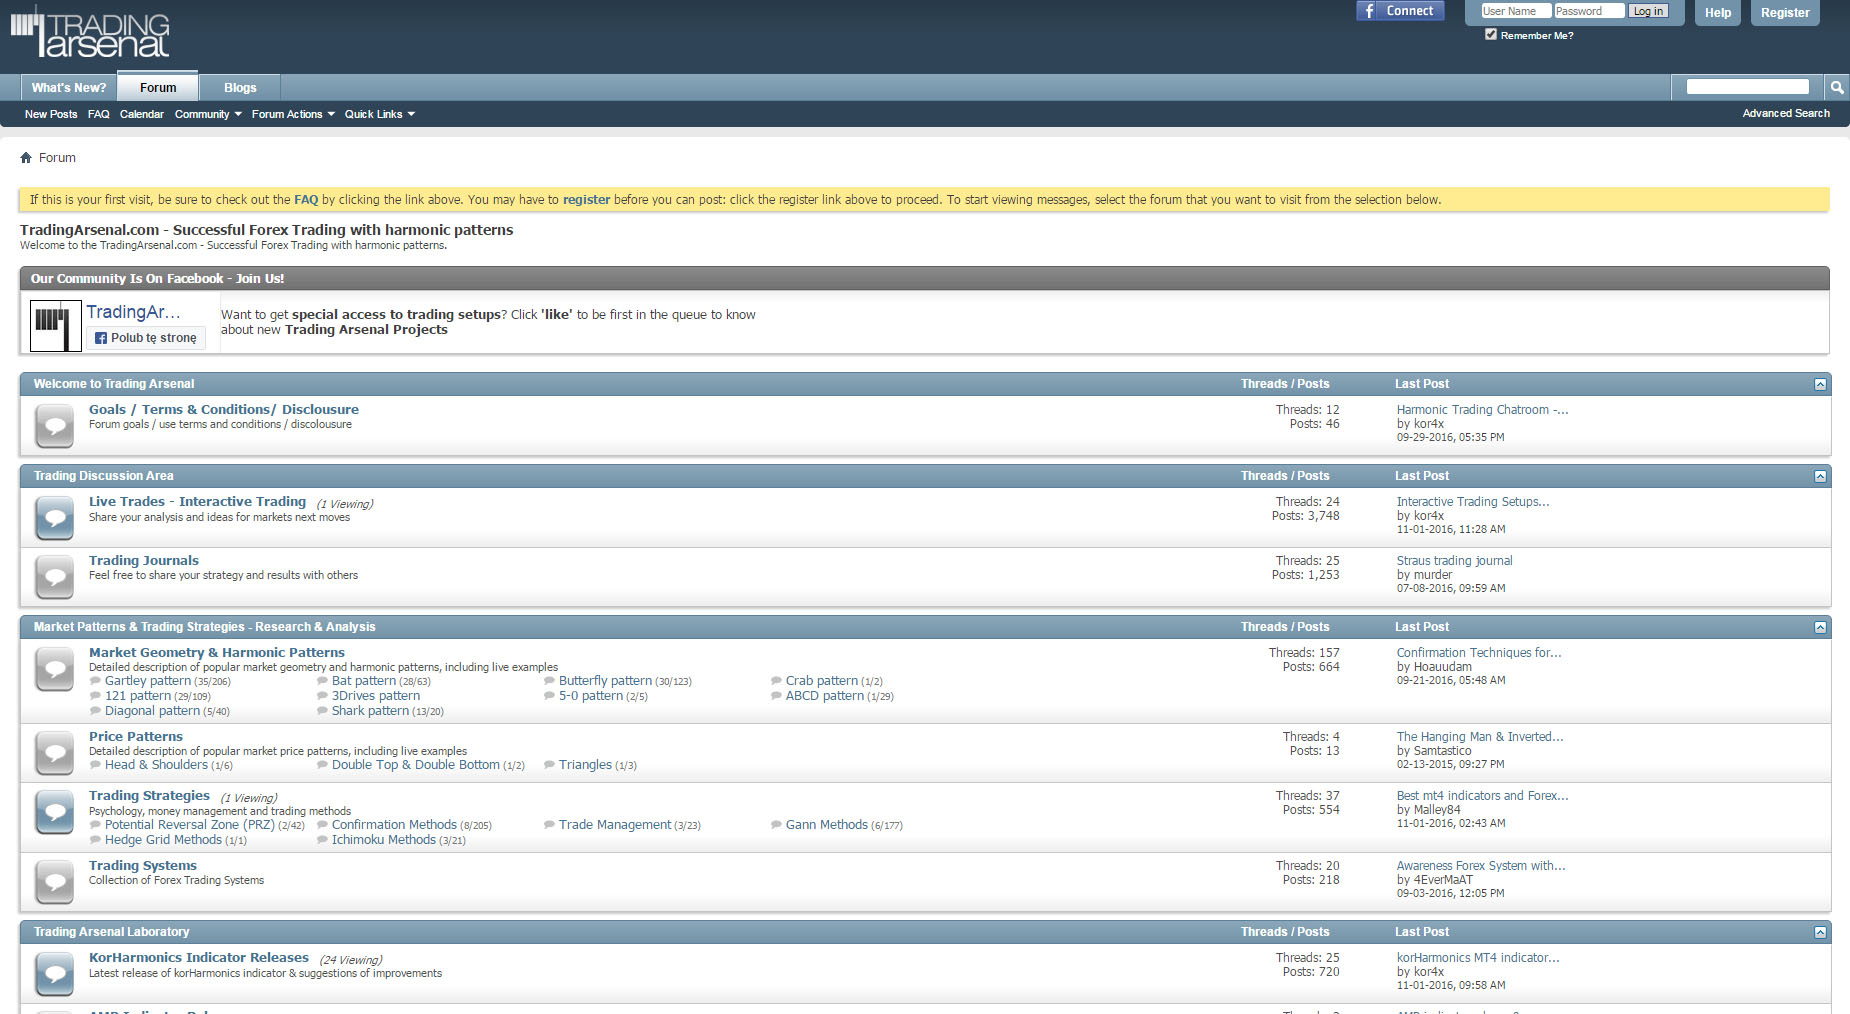
Share your ideas, learn from the others.
Share your ideas, learn from the others.
Join the community. Visit forum.
Related Products


1 licence = 1 MT4 account, one time fee, updates free
sent via email within 24 hours